Guide 3 of 3 — Reading Ocean Data
Reading Ocean Data — Putting It All Together
In the first two guides we covered what chlorophyll and water clarity (Kd490) show, and why edges, shapes, and movement matter. Here we tie it together: how sea surface temperature (SST), chlorophyll, water clarity, and currents work as one system—and how to turn that into a high-probability starting plan instead of guessing.
One System, Multiple Layers
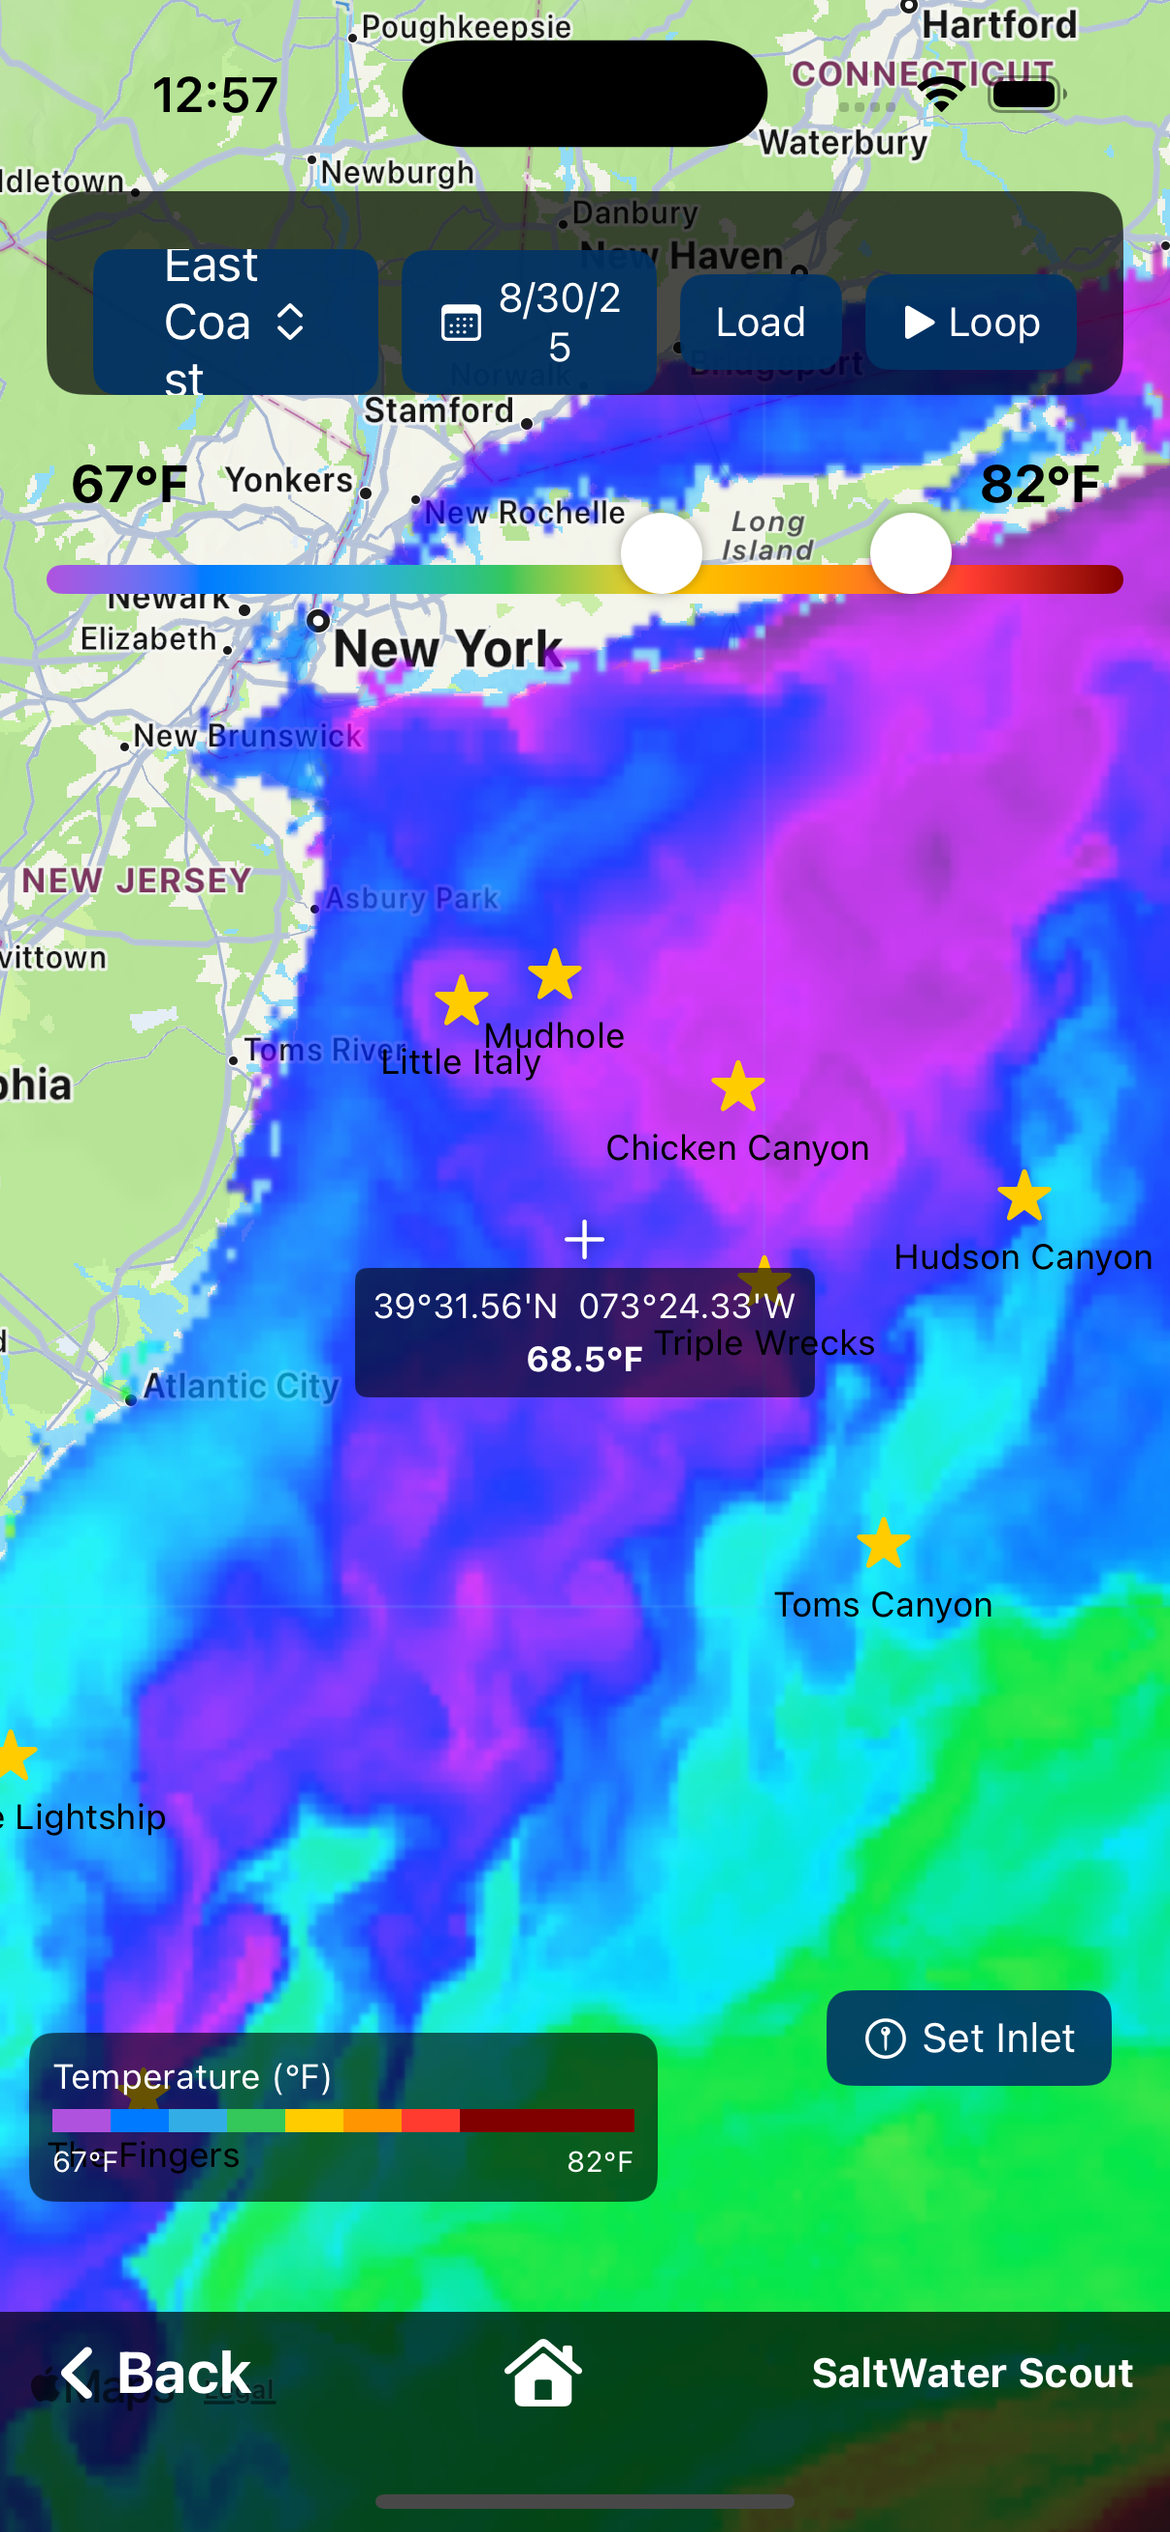
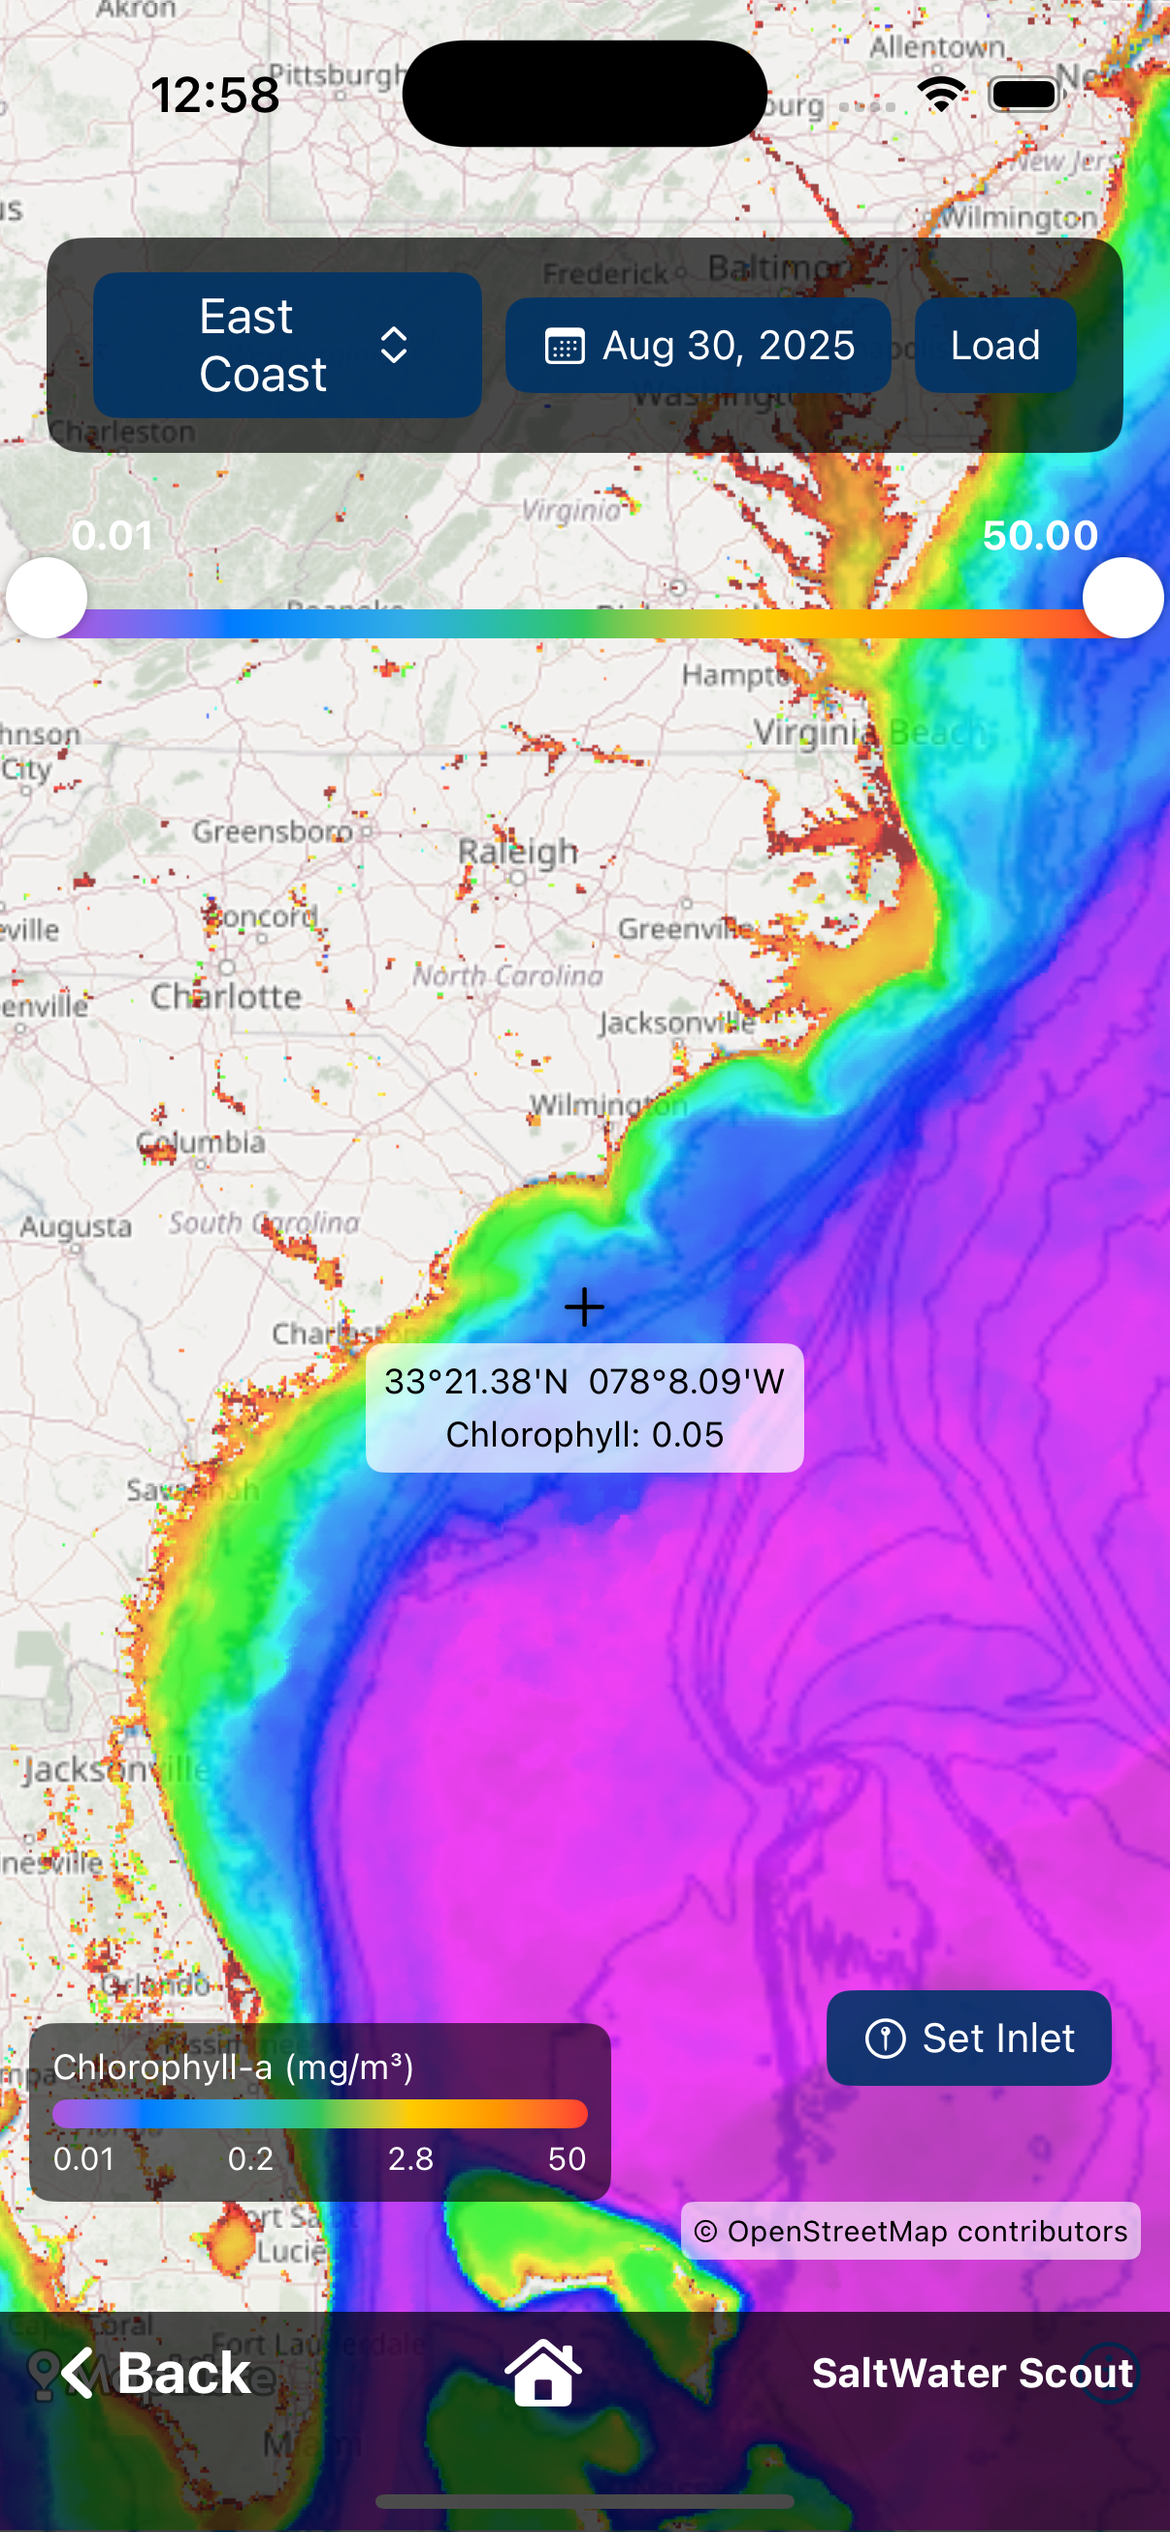
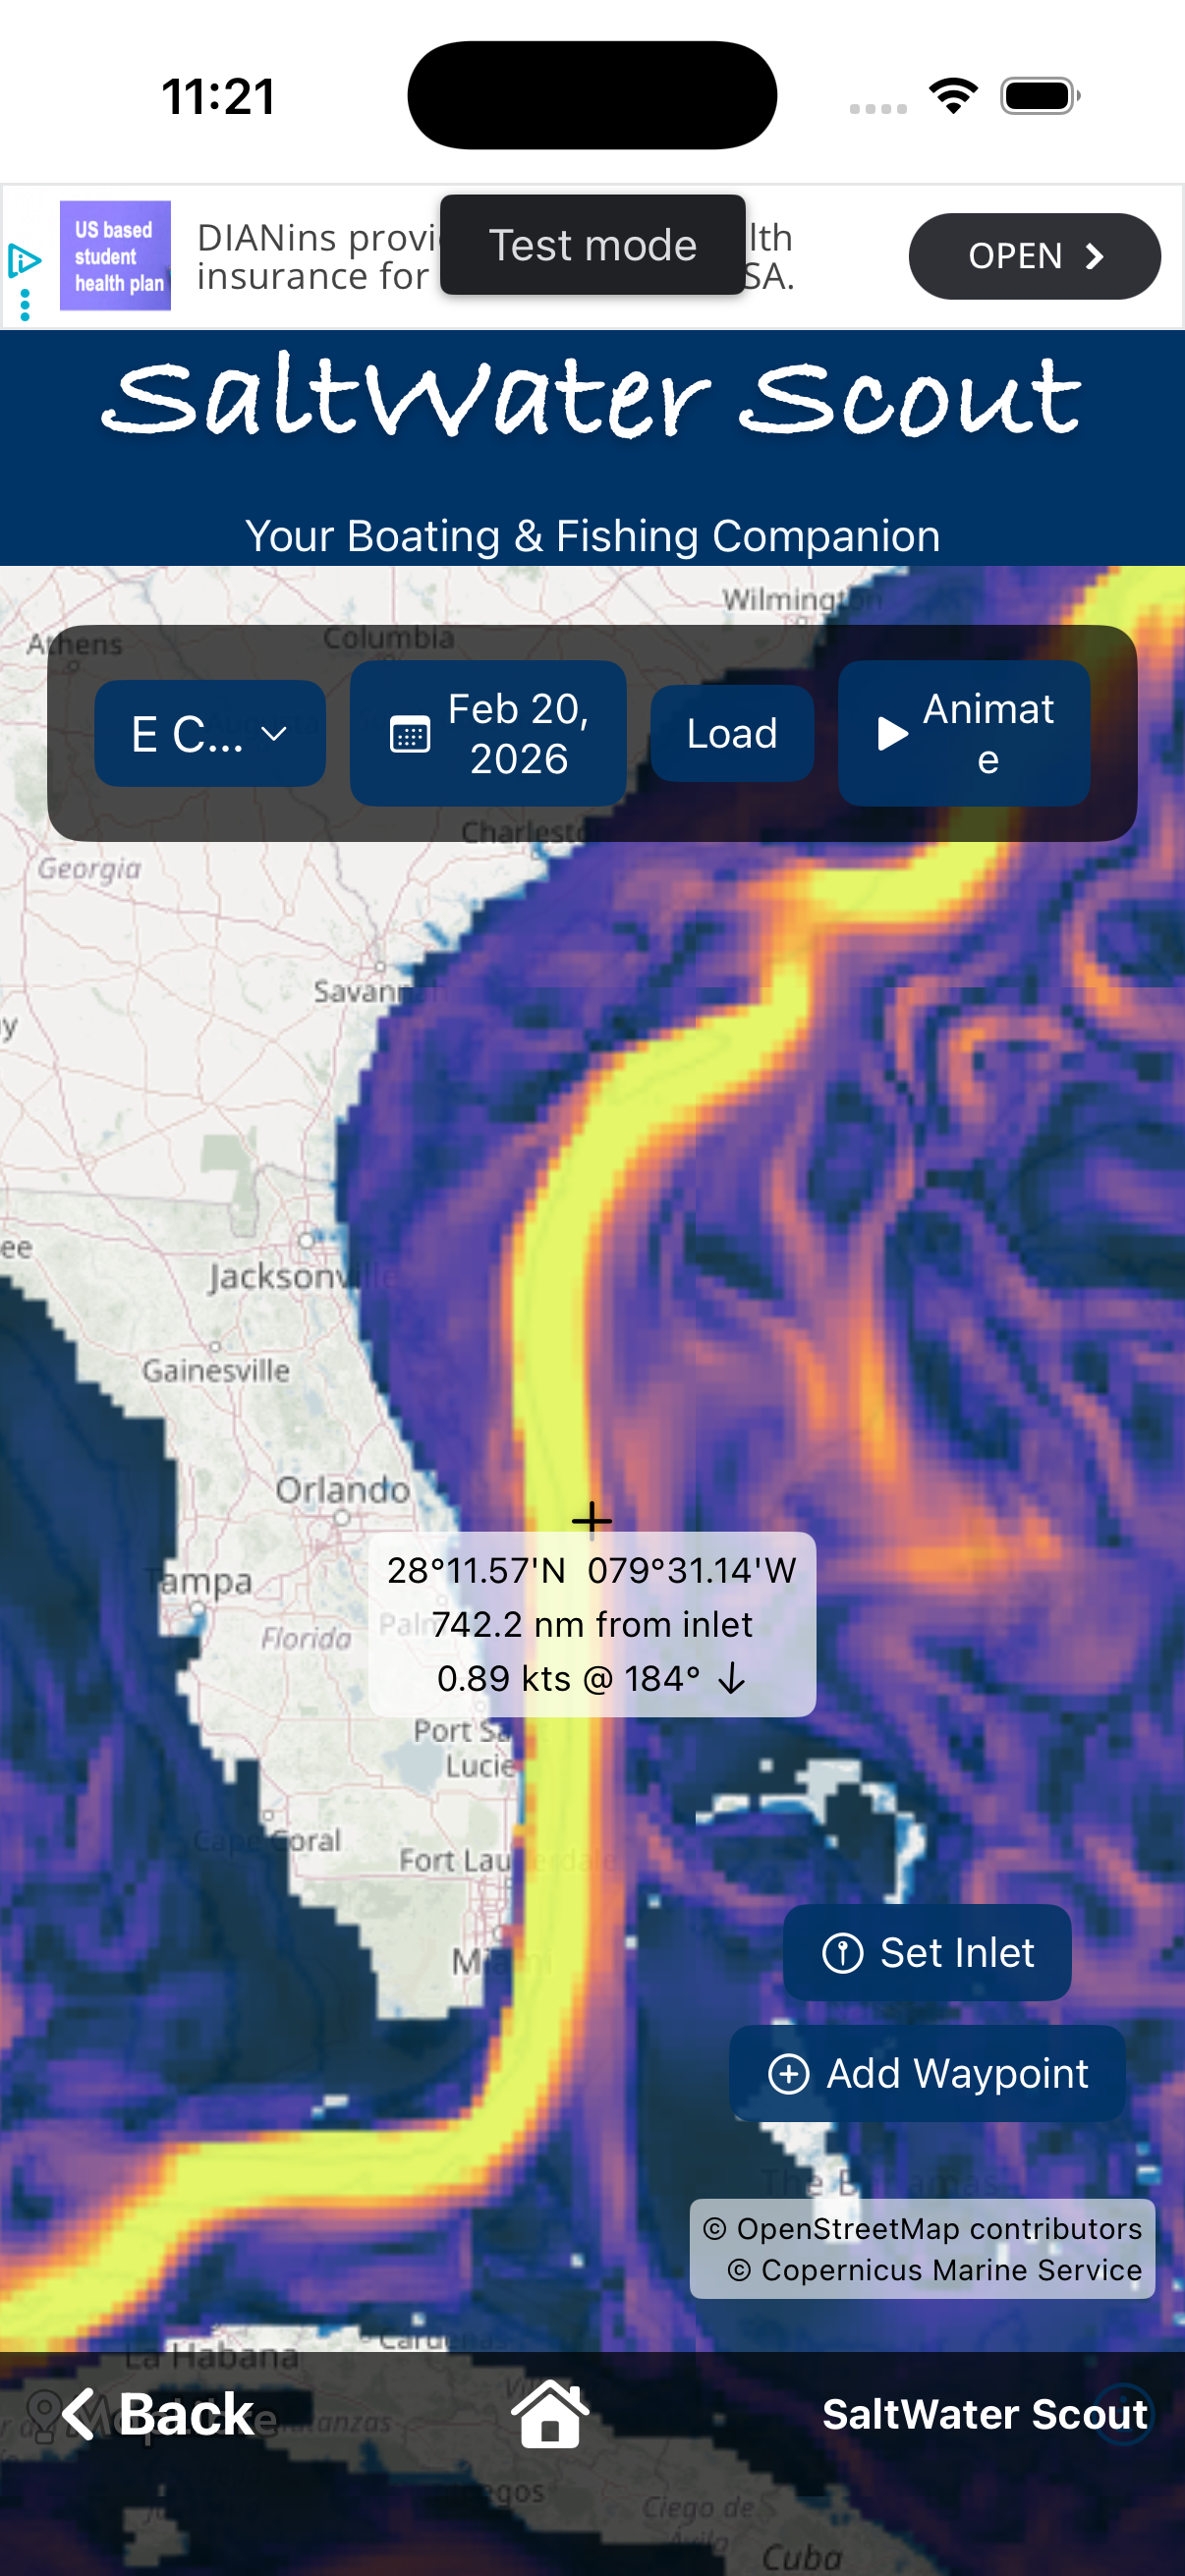
No single layer tells the whole story. SST shows where warm and cold water meet. Chlorophyll shows where the food chain is being supported. Water clarity shows where predators can see and feed. Currents show how water is moving and where boundaries are being pushed or held.
When the same edges or boundaries show up on two or more layers—especially SST plus chlorophyll or clarity—you have confirmation. Those are the spots worth waypointing and checking first.
From Maps to a Plan
Start with raw (non cloud-corrected) SST to see sharp thermal edges. Compare with chlorophyll and water clarity: do the edges line up? Use the 5-day play to see whether those edges are holding or moving. Drop waypoints on the best-looking boundaries, then switch layers to see how the same spots look on chlorophyll and clarity. In SaltWater Scout, waypoints stay consistent across every ocean data map—so you can compare the same spots across SST, Chlorophyll, Water Clarity, and Currents without re-marking.
Prioritize edges that have held their shape for several days and where multiple layers agree. That’s your high-probability starting plan.
Keep Learning
Patterns repeat: contrast, edges, and movement matter everywhere. The more you compare the layers and watch how they change over the 5-day sequence, the better you’ll read the ocean.
Use the Ocean Data layers in SaltWater Scout to put this into practice. Download free for iOS and Android.